Low Temperature Differential Stirling Engine Pressure Volume Diagram
Real time LTD Stirling engine pressure volume diagram
Hirokonakahara has a few fascinating videos on YouTube. He has successfully attached sensors to his LTD Stirling engine by Kontax and managed to create a real time Stirling engine pressure volume diagram on his computer!
As he runs his diagnostics on the LTD you can see the PV diagram change with and without load on the engine. Hirokonakahara gives more information in his video description (quoted below). I’ve also included links to his YouTube Channel at the bottom of this page. You can see more of his Stirling engine pressure volume diagrams and other videos there.
Quote from the Video Description:
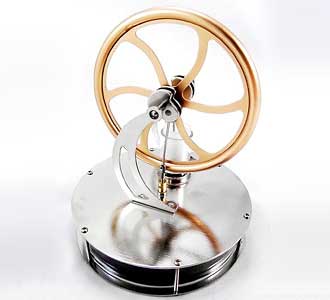
"A Stirling engine is a type of a heat engine that runs when a temperature difference is applied between the top and bottom plates of the engine body. In this video the top plate is at room temperature and the bottom plate is sitting on top of a cup filled with hot water. This Stirling engine was purchased from the British company “Kontax”. This is a video of a working Stirling engine.
A plot of pressure versus volume (PV‐diagram) is a graphical representation of the work done by an engine. The area inside the closed path on the PV‐diagram corresponds to the work per cycle done by the engine. The PV‐diagram of the Stirling engine is plotted on the computer monitor in real‐time. The top plate of the Stirling engine was modified to accommodate simple digital instruments from Venier to monitor the pressure and volume inside the engine. Using the LoggerPro data acquisition program the PV‐diagram is plotted in real‐time.
In the beginning of this video friction is applied to the engine by placing a sponge in contact with the flywheel and the PV‐diagram is recorded. Later, the fiction is removed and the engine starts to speed up and eventually reaches its maximum speed. As the engine speeds up the area of the loop in the PV‐diagram decreases."
More of Hirokonakahara’s Videos

You can find more of Hirokonakahara’s videos including his Stirling Engine Pressure Volume diagram at his YouTube Channel. He also has a video of his LTD engine running on a cup of hot water were you can better see the sensors that are installed. The sensors are for relaying the information to the computer. The computer then produces the Stirling engine pressure volume diagram.